Designing for Nasdaq Trade Surveillance: Making Market Abuse Visible
Company
Nasdaq
Role
UX Lead Designer
Responsibilities
End-to-end UX leadership
Complex workflow design
User journeys & interaction architecture
Design system definition & UI specification
Research & cross-team alignment
Context
Trade surveillance platforms help banks monitor trading activity and detect potential market manipulation. Compliance officers rely on them to investigate abusive behaviours and ensure their firms remain aligned with regulatory expectations.
Market abuse strategies are becoming increasingly sophisticated, yet existing tools often only allow monitoring one instrument at a time — making complex abusive behaviours difficult to detect.


Challenge
Our task was to design a new feature that gave compliance officers a clear, visual way to detect and investigate abusive trading activity across financial instruments. The feature needed to be intuitive enough to use without extensive training while also handling large volumes of complex data.
At the same time, the project required careful scoping. We had to decide which elements would form the MVP release versus later paid-tier functionality, while aligning customer needs with technical feasibility. Delivering value quickly without overextending scope was key to meeting both regulatory expectations and customer needs.

Process & Research
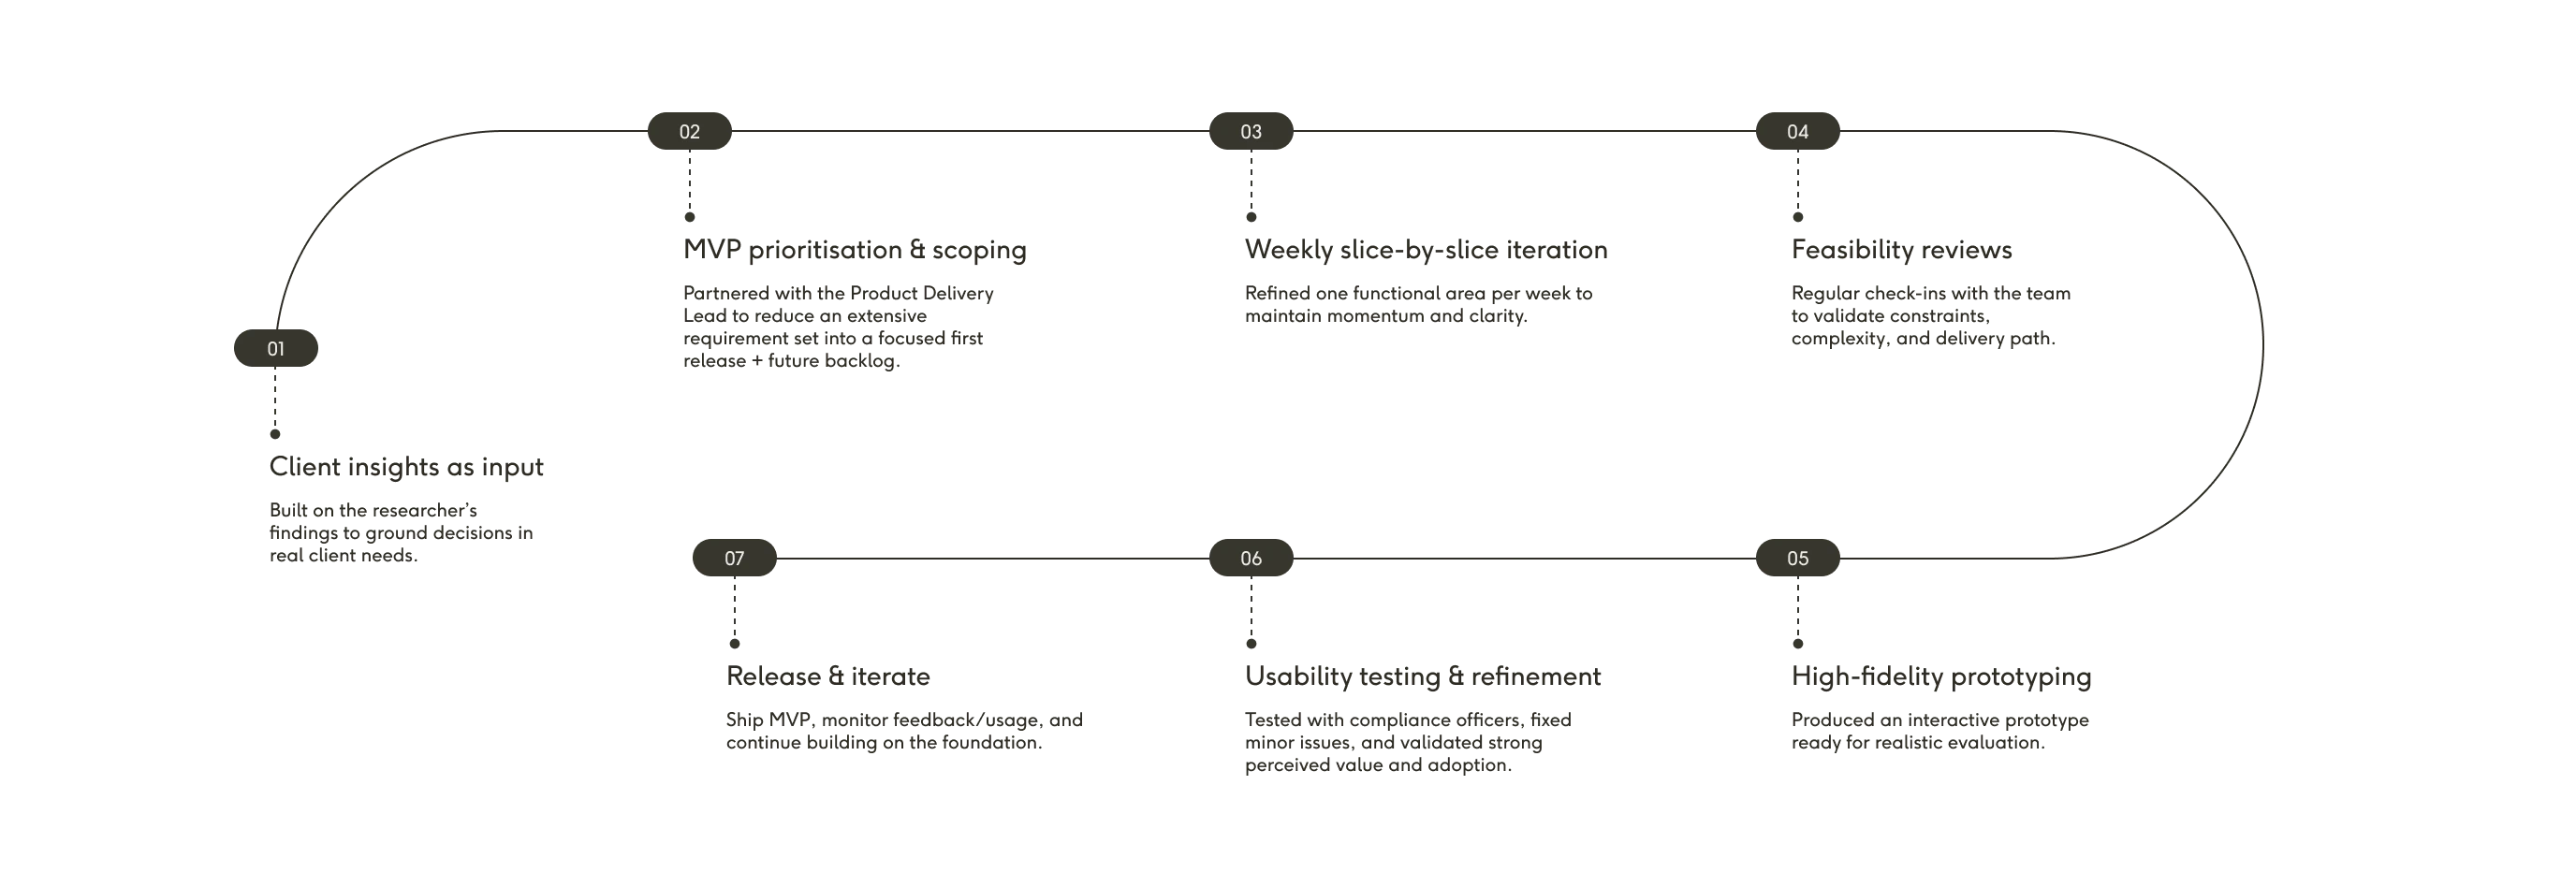
I built on the researcher’s client insights to prioritise needs into a realistic MVP with the product delivery lead. This reduced an extensive set of requirements into a focused first release while laying the foundation for future iterations.
Each week, we refined one piece of functionality at a time, building the feature step by step while reviewing feasibility with the team.
When the high-fidelity prototype was ready, we tested it with compliance officers. Testing surfaced some minor usability issues, which we refined in the design. Feedback was very positive: participants found the feature intuitive, easy to adopt, and valuable for investigating modern trading behaviours.

Solution & Impact
The final design is a multi-step investigation flow that supports compliance officers in detecting and analysing abusive trading behaviours. It combines a dedicated component for reviewing alerts, a workspace for adjusting parameters, and a supporting flow for testing scenarios before release.
The design uses grouping, hierarchy, and highlighting to make large datasets digestible, helping officers focus on the riskiest areas first.
The feature is designed to significantly reduce investigation effort, provide clients with regulatory alignment, and create new business value through advanced paid-tier functionality. Early usability testing showed strong adoption potential, with compliance officers describing the feature as intuitive, easy to use, and immediately valuable.

Reflection & Learnings
Translating Complexity
Balancing extensive requirements with technical feasibility taught me how to scope realistically while still designing a solution that could scale.
Collaboration as a Driver
Close collaboration with researchers, product, and delivery teams was essential to move the project forward and align business, user, and technical needs.
Validating Early
Usability testing ensured the feature was intuitive out of the box, so compliance officers could adopt it quickly with minimal training.
From Fragmentation to Consistency: Building a Fintech Platform Design System
© 2025
Design and code by
Typeset in F37 Ginger by